I started a Blazor WebAssembly project the other day and noticed something I hadn't seen before. The console output mentioned a "debug" URL:
App url: http://localhost:5199/
Debug at url: http://localhost:5199/_framework/debug
Naturally, I visited the debug URL. It told me my browser wasn't configured for debugging and gave me a command to run. After running Chrome with the magic flags, I refreshed the page and saw something called "Inspectable pages"—a list that included my app, a Chrome internal page, and some service worker.
What is all this? When did debugging become so... involved?
The Short Answer
Blazor WebAssembly apps run in the browser, not on a server. That means you can't just attach Visual Studio to a process and set breakpoints. Your C# code compiles to WebAssembly, runs inside a JavaScript sandbox, and the .NET runtime itself is executing in that sandbox. Traditional debugging doesn't work.
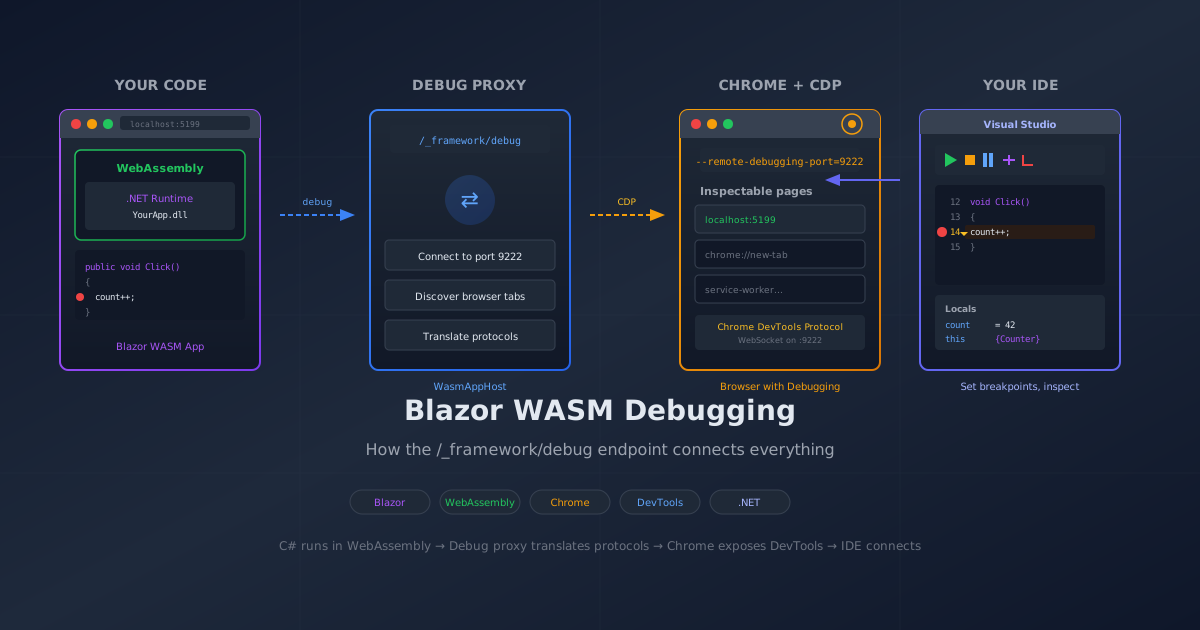
So the Blazor team built a debugging proxy. The /_framework/debug endpoint you saw is that proxy. It connects your browser's DevTools to the .NET debugging infrastructure, translating between Chrome's debugging protocol and .NET's debugging protocol.
But for any of this to work, Chrome needs to expose its debugging interface. That's what the --remote-debugging-port=9222 flag does.
How It Got Enabled
You didn't enable anything special. The debug endpoint is part of the default Blazor WebAssembly development template. When you run dotnet run in development mode, the WebAssembly host (WasmAppHost) automatically serves that /_framework/debug endpoint.
Look at what the console output said:
WasmAppHost --use-staticwebassets --runtime-config bin\Debug\net9.0\MyApp.runtimeconfig.json
That WasmAppHost is the key. It's a specialized development server that knows how to serve Blazor WebAssembly apps and includes the debugging proxy. In production, you'd deploy the app as static files to any web server—no WasmAppHost, no debug endpoint.
What the Chrome Command Does
When you ran this:
chrome --remote-debugging-port=9222 --user-data-dir="%TEMP%\blazor-chrome-debug"
You told Chrome to do two things:
--remote-debugging-port=9222: Start a debugging server on port 9222 that speaks the Chrome DevTools Protocol (CDP). This is the same protocol that Chrome DevTools uses internally, the one that Puppeteer and Playwright automate with, and the one that every browser-based debugging tool relies on.--user-data-dir=...: Use a separate profile directory. This prevents conflicts with your normal Chrome session and its extensions, cached data, and settings. The debugging session gets a clean slate.
The debugging proxy at /_framework/debug connects to localhost:9222 and discovers what tabs (they call them "targets") are available for debugging. That's the "Inspectable pages" list you saw.
The Inspectable Pages
Let's break down what you're seeing:
New Tab (http://localhost:5199/_framework/debug) This is the debug page itself—the one showing the list. Yes, it's meta. The debug UI is itself an inspectable target.
chrome-untrusted://new-tab-page/...
This is Chrome's internal new tab page. Chrome uses special chrome:// and chrome-untrusted:// URLs for internal functionality. These show up in the debugging target list because they're technically browser tabs.
Service Worker (chrome-extension://...) This is a service worker from a Chrome extension. The debugging session exposes all targets, including extension workers. That long ID is the extension's unique identifier.
The one you actually want to debug is probably not in that list yet—you need to navigate to your actual app at http://localhost:5199/ (not the debug URL) in that special debugging Chrome instance.
The Debugging Flow
Here's the full picture of what happens when you debug a Blazor WASM app:
┌─────────────────┐     ┌──────────────────┐     ┌─────────────────┐
│  Your C# Code   │     │  Debugging Proxy │     │  Chrome + CDP   │
│  (WebAssembly)  │────▶│  /_framework/    │────▶│  Port 9222      │
│                 │     │  debug           │     │                 │
└─────────────────┘     └──────────────────┘     └─────────────────┘
        │                        │                        │
        ▼                        ▼                        ▼
   .NET Runtime            Translates between         Chrome DevTools
   in Browser              .NET debugging and         Protocol (CDP)
                           CDP protocols
- Chrome runs with debugging enabled on port 9222
- You navigate to your app in that Chrome instance
- The debugging proxy connects to Chrome via CDP and discovers your tab
- You connect your debugger (VS Code, Visual Studio, or the browser DevTools)
- The proxy translates breakpoints and variable inspection between .NET and Chrome
- You debug C# in a browser like it's the most normal thing in the world
Debugging in Visual Studio (The Easy Way)
If all this manual setup sounds tedious, you're right. Visual Studio handles it automatically:
- Press F5 to start debugging
- Visual Studio launches Chrome with the right flags
- Attaches the debugger automatically
- Sets breakpoints in your C# code
- You debug like it's a normal .NET app
The manual approach is only needed when:
- You're using VS Code without the Blazor debugging extensions
- You want to attach to an already-running app
- Something goes wrong with the automatic flow
- You're curious about how it works (guilty)
VS Code Setup
For VS Code, you need the C# extension and a proper launch.json:
{
    "version": "0.2.0",
    "configurations": [
        {
            "name": "Launch and Debug Blazor WebAssembly",
            "type": "blazorwasm",
            "request": "launch",
            "cwd": "${workspaceFolder}",
            "browser": "chrome"
        }
    ]
}
This tells VS Code to:
- Build your Blazor WASM app
- Start the dev server
- Launch Chrome with debugging enabled
- Connect all the pieces
No manual Chrome commands needed.
The Debugging Experience
Once everything connects, you can:
- Set breakpoints in your
.razorand.csfiles - Inspect variables in the debugger
- Step through code line by line
- Watch expressions as they evaluate
- Use the call stack to trace execution
It feels like debugging any .NET app, except your code is running in WebAssembly inside a browser. The debugging proxy makes the translation invisible.
There are limitations, though:
- Hot reload can be flaky with the debugger attached
- Some variable inspection doesn't work for complex types
- Performance suffers with breakpoints enabled
- The browser DevTools network tab is still useful for HTTP debugging
Why Not Just Use Browser DevTools?
You can! Chrome DevTools will show you:
- Network requests from your app
- Console output
- DOM inspection
- Performance profiling
But it won't let you set breakpoints in C# code. The Sources panel shows your WebAssembly binary, not your source files. For JavaScript interop debugging, browser DevTools is great. For C# logic? You need the .NET debugging proxy.
What About Firefox?
Firefox supports a similar debugging protocol, but Blazor's debugging proxy has historically been Chrome-focused. The Edge instructions you saw (with msedge --remote-debugging-port=9222) work because Edge is Chromium-based and speaks the same CDP protocol.
Firefox support is improving, but if you're debugging Blazor WASM, Chrome or Edge are your safest bets.
Production vs. Development
In development:
WasmAppHostserves your app with debugging support- The
/_framework/debugendpoint exists - Source maps and debug symbols are included
- Performance is secondary to debuggability
In production:
- You deploy static files (HTML, CSS, JS, WASM)
- No
WasmAppHost, no debug endpoint - Files are trimmed and optimized
- Debugging infrastructure is stripped out
This is why the debug endpoint "just appeared"—it's automatic in development and absent in production.
When Things Go Wrong
If the debug endpoint can't find your browser:
- Chrome not running with debugging flag: Start Chrome with
--remote-debugging-port=9222 - Wrong port: The proxy looks for port 9222 by default
- Chrome already running: The debugging flag only works if Chrome wasn't already running. Quit all Chrome instances first.
- Firewall blocking localhost: Rare, but it happens
If you can see "Inspectable pages" but can't debug:
- Navigate to your actual app URL (not
/_framework/debug) - Check that your app appears in the inspectable pages list
- Attach your debugger to that specific target
The Mystery Solved
So to answer the original questions:
How did this get enabled? It's part of the default Blazor WebAssembly development experience. The WasmAppHost dev server includes the debugging proxy automatically.
What is going on? The debugging proxy bridges between Chrome's DevTools Protocol and .NET debugging. The "Inspectable pages" list shows all debugging targets Chrome exposes on port 9222—browser tabs, service workers, the works. You need to navigate to your actual app (not the debug URL) in that debugging-enabled Chrome session, then connect your debugger.
It's more complex than debugging server-side .NET code, but it's also kind of amazing that we can debug C# running as WebAssembly in a browser at all. The fact that it mostly just works in Visual Studio is a small miracle of engineering.
Running into Blazor debugging issues? Drop a comment below—debugging debuggers is its own special kind of fun.